Managing Performance in Media Servers
Introduction #
Unless your media server has a ‘side-car’ GPU dedicated to Notch rendering, your Notch effects will be sharing the same GPU processor as the media server software. Successful shows require an understanding of GPU resources.
When rendering at 60 frames a second, the GPU has 16.6 milliseconds to do all the work required to render and present it’s content to the connected output devices (monitors, projectors etc.). During this 16ms, the GPU has to perform activities for the media server software (uploading video frames, warping for projectors) as well as render any Notch content you are playing at that particular moment.
Therefore: GPU load = Media Server Time + Notch Render Time
The times available at different frame rates are:
- 60fps = 16.6ms
- 50fps = 20.0ms
- 30fps = 33.3ms
- 25fps = 40.0ms
Notch Builder is an ‘open’ tool. It allows you to run as light or heavy effects as you wish (you can drive it off a cliff) but also gives you the tools to manage this.
How to measure your Notch project’s load #
You need to measure your project’s GPU load on the target machine as GPU power differs from card to card. You can also use the Performance Panel to estimate GPU load on a target machine.
Please refer to your media server vendor for details on viewing the GPU time of the media server.
Please note: Some media servers allow you to measure the time a Notch block is taking to render within the media server. However, if that feature is not available in your media server, you can do it manually:
- Install Notch Builder on the target machine
- Load your Notch project
- In project settings
- Set the Output Width and Height to the size of your target canvas in the media server.
- Set the Output Resizing to Scale/Filter Output To Window
- Click OK
- Set your Resolution sizing to 100% (RES button)
- Play your project
- Observe the GPU statistic on the Status Bar
![]()
If you would like more details on what aspects of the scene are taking the GPU time you can use the Notch Profiler
- In the Nodes/Profiler/Exposed panel (usually bottom right), select Profiler
- Click Enabled (turns white)
- Play your project
- Observe the Profiler pane. The Frame Begin represents the total frame time – The left value is the GPU, right is CPU.
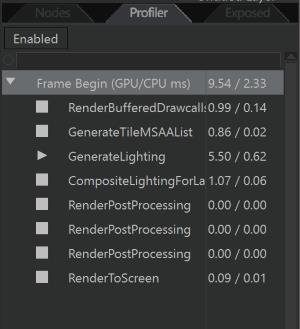
The profiler also allows you to see what aspects of the Notch render pipeline are taking time, to allow you to make some educated decisions.
With this information, plus an understanding of the GPU time taken by the Media Server, you have a total picture of GPU usage.
How to measure your Media Server’s GPU time #
Media Server’s measure their GPU time in different ways. Most measure the total time including the time taken by all Notch content that is currently rendering. Therefore to calculate the media server time you must either:
- Baseline the server without Notch content running
- Calculate the following: Media Server GPU Time = Total GPU time - Notch GPU time
Common Performance Issues #
Cross fades double the load #
Most media servers support cross fades between cues or timeline points. It’s important to bear in mind, that in the middle of your cross fade, you might have two sets of Notch content running in parallel.
Frequently Asked Questions #
Is there a limit to the number of ’layers’ of Notch content that can be played on a machine? #
Notch Playback does not impose any restrictions on the number of layers allowed to play in parallel. But your media server might, so check with the vendor.
How powerful is XYZ GPU for Notch rendering? #
Take a look at the “Notchmarks “:https://www.notch.one/notchmarks/ to compare the relative performance of various GPUs and media servers.