Profiler
Updated: 3 Mar 2026
Updated: 3 Mar 2026
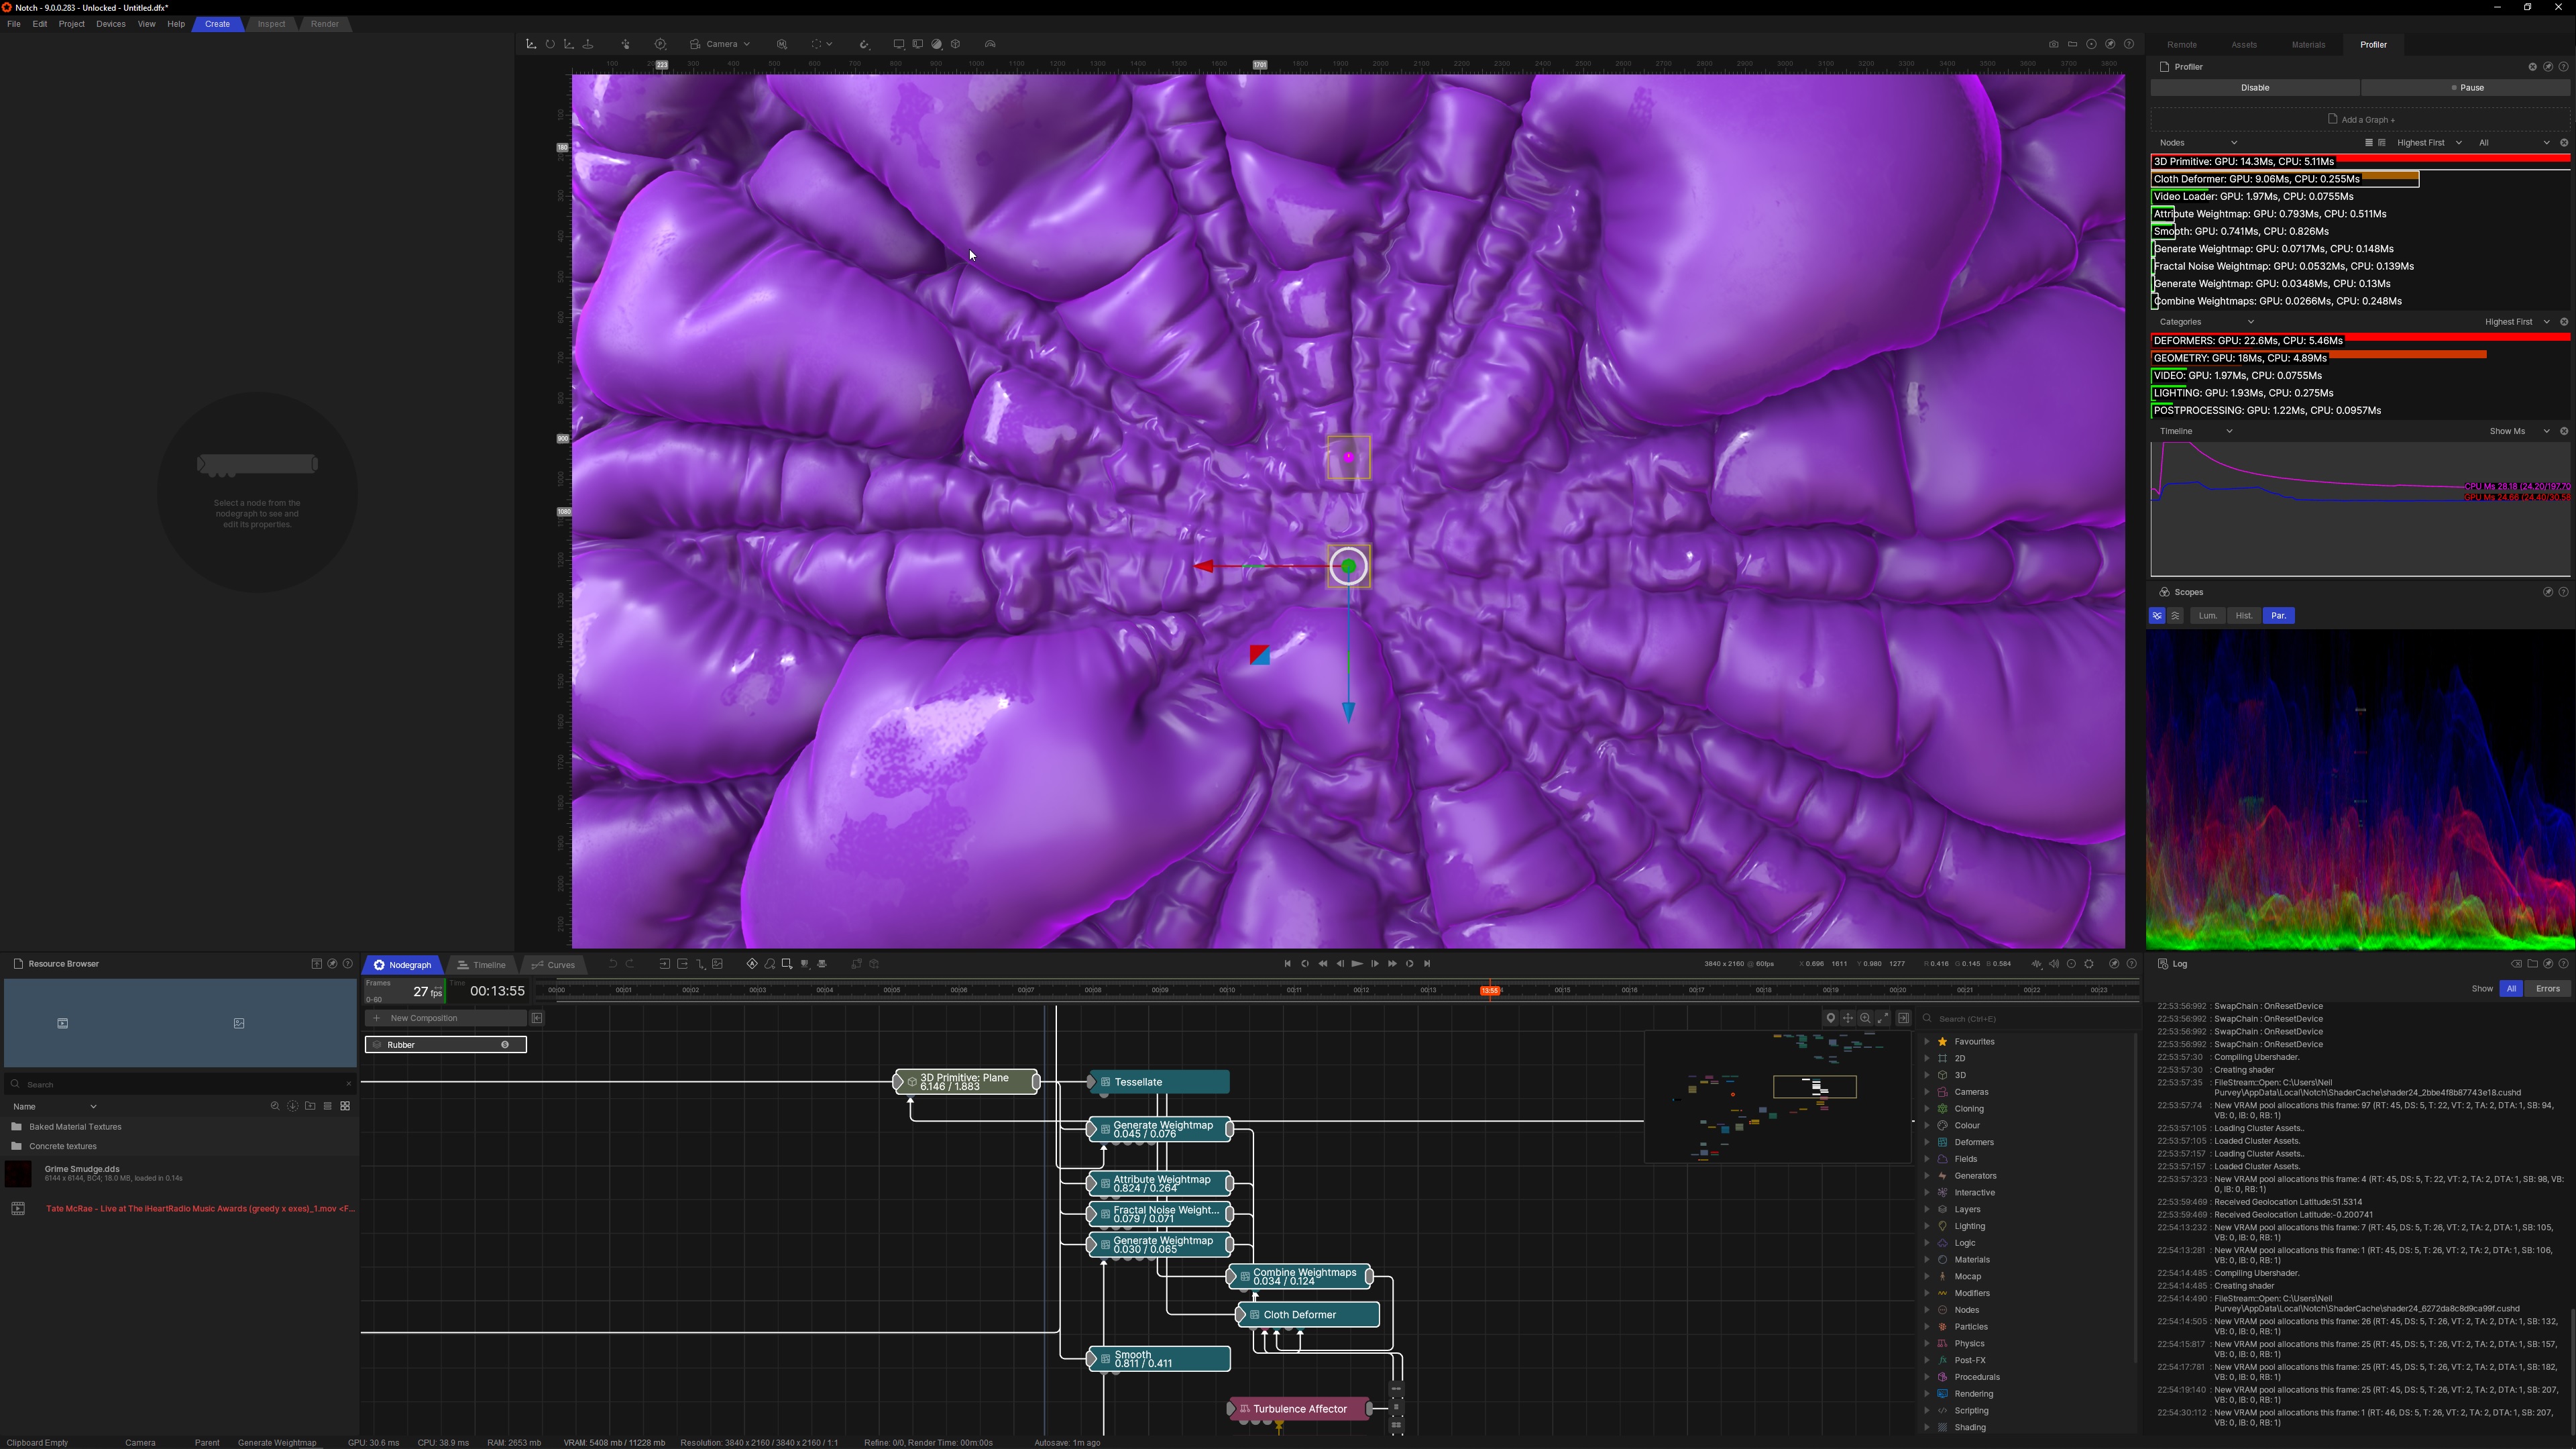
This panel allows you to profile the currently loaded DFX and narrow down hot nodes in the Nodegraph.
For a quick start profiling; enable profiling by pressing the ‘Enable’ button, pressing the ‘Play’ button and pressing the ‘Add Graph +’ button. Play your DFX and a list of profiled nodes shall appear in real-time. At any stage during playback you can press the ‘Pause’ button to look at the profile at that particular time.
In graphs, click on the node bars to highlight that node in the Builder nodegraph. If you click a category bar it will highlight all of the nodes that are associated with that category to help you identify ‘hot’ nodes in the graph to start optimising. Selections in the Builder nodegraph are also reflected as selections in the profiler graphs.
| Icon | Label | Description |
|---|---|---|
|
|
Remove All Graphs | Removes all graph windows added with the use of the ‘Add A Graph +’ button. |
| Undock | Undock this panel and place it somewhere else. For more, see our User Interface Page. | |
| Help | Takes you to the manual page for this panel. Perhaps that’s how you got here? | |
|
|
Enable / Disable | Enable or disable the profiler for use during playback. |
|
|
Play / Pause | Play or pause profiling during DFX playback. |
|
|
Add A Graph + | Add another profile graph to the profiler panel (defaults to a Flat Bar graph of Nodes). |
Each graph that is added to the Panel via the Main interface ‘Add Graph +’ button can have both graph type and graph type specific options to organise the profiling data to fit your profiling workflow.
| Icon | Label | Description |
|---|---|---|
| Pulldown | Graph Type | Options are ‘Nodes’, ‘Categories’ or ‘Timeline’ detailed below |
|
|
Remove Graph | Removes the graph window from the profiler panel. |
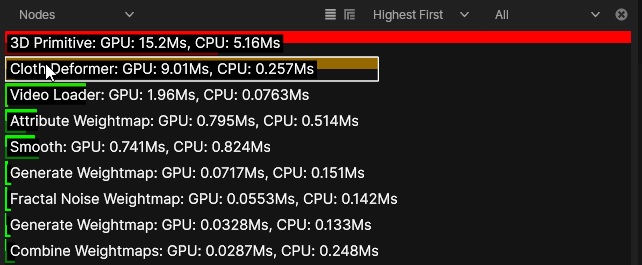
The Nodes graph type allows you to show timing information per node graph node.
You have 2 layout modes to choose from; Flat or Flat Hierarchical.
Flat layout enables you to see a flat list of nodes in the sorting order you choose, for example in order of Highest time spent per frame.
| Icon | Label | Description |
|---|---|---|
|
|
Flat Layout | Show per node timings as a Flat stack of time bars, it shows both the CPU and GPU timings on each bar. |
| Pulldown | Sort order | You can sort by Highest First (default), Lowest First, A-Z node name, Z-A node name order (Alphabetical ordering is only avilable in the Flat Layout mode). |
| Pulldown | Node Filtering | You can filter which Nodes appear on the profile bar graph. Options are: All, Selected Only (nodes selected in nodegraph), Pinned Only (nodes pinned in the nodegraph). |
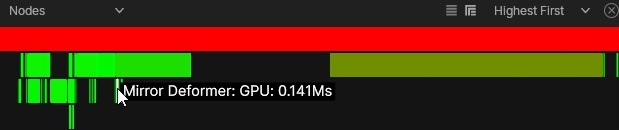
Flat Hierarchical layout enables you to see a flat list of nodes in the sorting order you choose, for example in order of Highest time spent per frame.
| Icon | Label | Description |
|---|---|---|
|
|
Flat Hierarchical Layout | Show per node timings as bars in hierarchical dependency order over time, it shows both the CPU and GPU timings on each bar. |
| Pulldown | Sort order | You can sort by Highest First (default), Lowest First, A-Z node name, Z-A node name order (Alphabetical ordering is only avilable in the Flat Layout mode). |
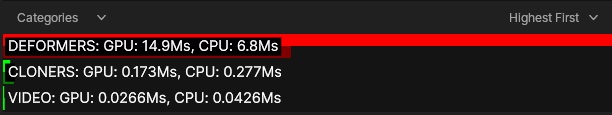
The Categories graph type shows you a stack of timing bars with aggregated times for specific categories e.g. ‘Deformers’, ‘cloners’ etc.
| Icon | Label | Description |
|---|---|---|
| Pulldown | Sort order | You can sort by Highest First (default), Lowest First, A-Z node name, Z-A node name order (all supported in this Flat mode). |
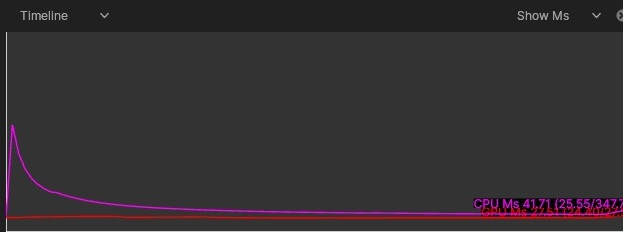
The Timeline graph type allows you to measure the performance of the nodegraph over time as a line graph which updates in real-time.
| Icon | Label | Description |
|---|---|---|
| Pulldown | Units | You can use either ‘Show Ms’ to show units of time in milliseconds, or ‘Show FPS’ to show units in frames-per-second. |